Visual Data Patterns: Improving Hand Reading in Online MTT Play
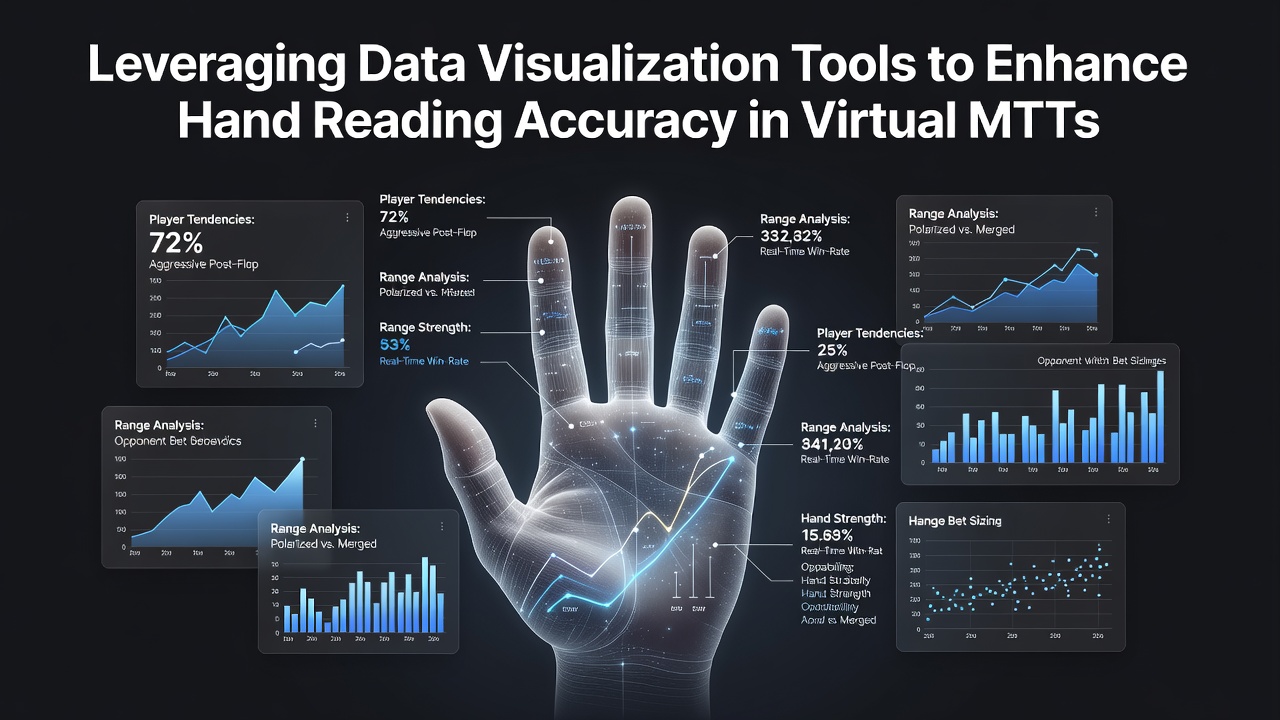
Online multi-table tournaments generate vast amounts of player data during each session, and data visualization tools convert those raw numbers into graphs, heatmaps, and trend lines that players examine to refine hand reading skills. Hand reading involves deducing likely holdings based on betting patterns, position, and historical actions, while visualization software highlights frequencies such as voluntary put money in pot rates, preflop raise percentages, and aggression factors across thousands of hands.
Core Components of Visualization Software in MTT Settings
Programs like PokerTracker 4 and Hold'em Manager 3 process hand histories from major platforms and display them through customizable charts that update in real time during tournament play. Observers note that these interfaces allow users to filter data by stack depth, stage of the tournament, and opponent type, which helps isolate tendencies that emerge only in specific scenarios such as bubble play or final table situations. Data shows that players who review visualized aggression metrics before each session adjust their calling ranges more precisely when facing continuation bets on coordinated boards.
Integration of Real-Time Dashboards During June 2026 Events
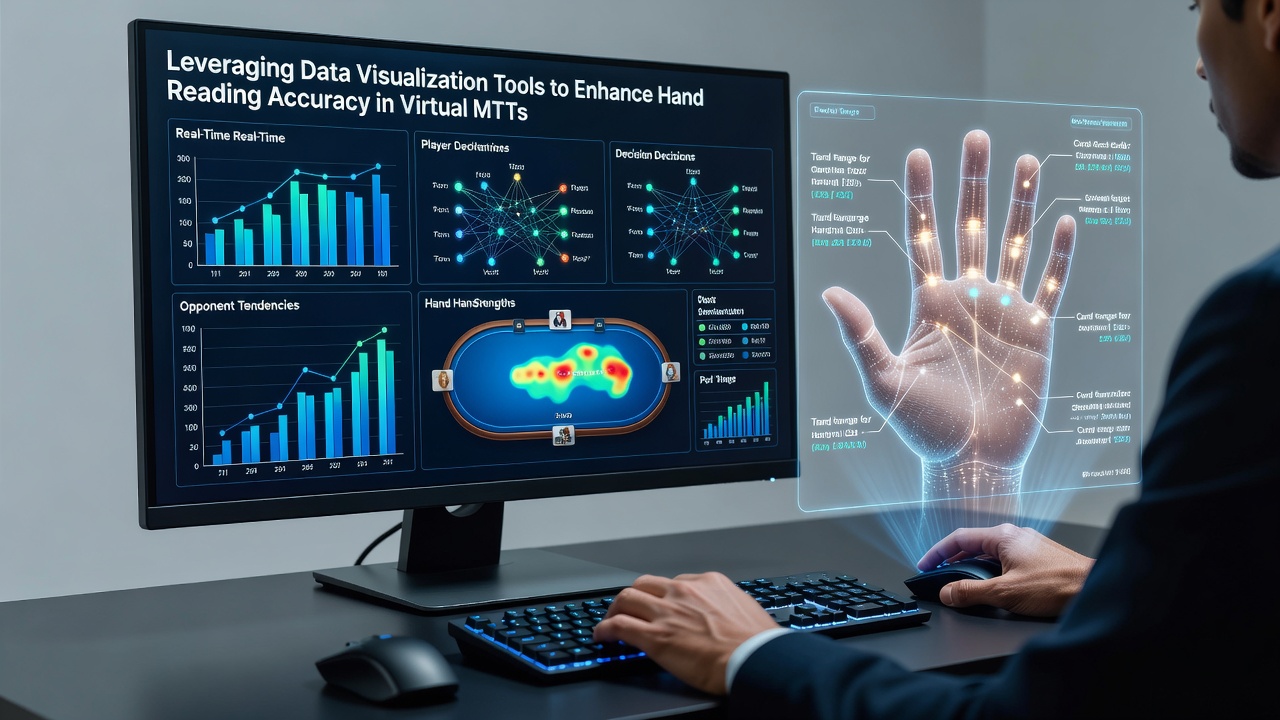
During the June 2026 online series on several major sites, participants reported increased use of overlay modules that combine equity calculations with historical opponent data rendered as color-coded grids. These grids update after every orbit and flag deviations from established baselines, such as an opponent who suddenly increases three-bet frequency when antes come into play. Research from the University of Nevada's gaming analytics group indicates that such layered displays reduce the cognitive load of tracking multiple variables simultaneously, allowing quicker identification of polarized versus merged ranges in three-bet pots.
Case Examples of Accuracy Gains Through Graphical Analysis
One documented instance involved a mid-stakes regular who overlaid scatter plots of flop continuation bet success rates against different player pools, revealing that certain regulars folded to delayed continuation bets at a 12 percent higher rate than population averages. After incorporating these plots into pre-session reviews, the player recorded a measurable uptick in river calling decisions that aligned with actual showdown holdings logged in the database. Another example comes from a study published by the Canadian Institute for Gambling Research, which tracked 150 MTT participants over six months and found that those who spent at least 30 minutes weekly examining visualized range breakdowns improved their in-game fold equity realization by noticeable margins compared with control groups relying solely on mental notes.
Linking External Data Sources to Visualization Platforms
Many tools now import anonymized aggregate statistics from regulatory filings and independent research repositories, including reports issued by the Nevada Gaming Control Board that detail volume trends across licensed online operators. Players combine these macro figures with their personal databases to calibrate expectations about how pool-wide tendencies shift during high-traffic periods. A separate academic paper from Monash University examined decision accuracy when participants viewed both raw tables and graphical summaries, and the results demonstrated faster recognition of outlier statistics when data appeared in visual form rather than spreadsheet columns.
Limitations and Technical Considerations
Visualization accuracy depends on the volume of hands collected for each opponent, and short-sample noise can produce misleading spikes in graphs that do not reflect true long-term frequencies. Software developers address this by including confidence interval overlays and minimum hand thresholds that users can set before patterns appear on screen. Network latency during peak tournament hours sometimes delays updates to real-time dashboards, forcing players to rely on cached historical views until synchronization resumes.
Conclusion
Data visualization tools continue to supply structured representations of complex poker statistics that support more precise hand reading during virtual MTTs. By converting action histories into accessible visual formats, these applications enable players to identify range discrepancies and adjust decisions based on documented patterns rather than memory alone. Ongoing integration of external research datasets and improved filtering options suggest further refinement of these methods in future tournament cycles.