Strategic Alignment of Bankroll Curves and Tournament Schedules
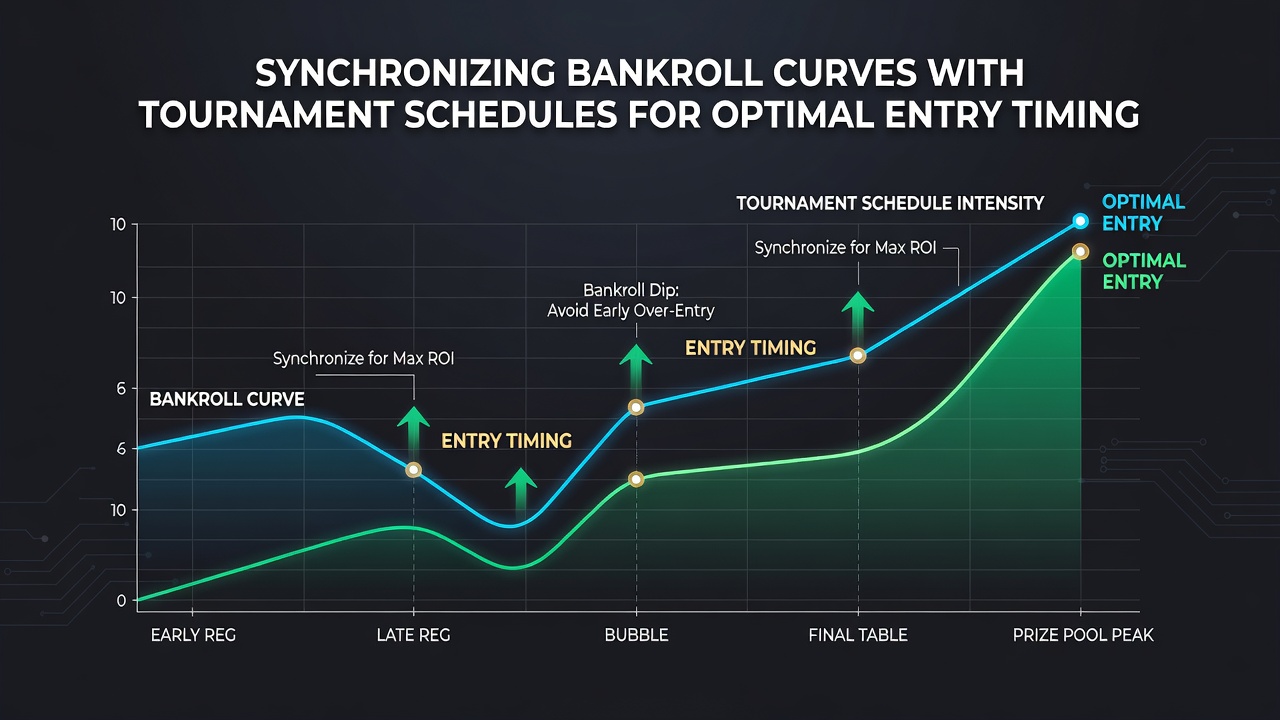
Bankroll curves represent the trajectory of a player's available funds across multiple sessions and events while tournament schedules outline fixed calendars of competition opportunities that repeat annually or seasonally. Observers note that synchronization involves mapping projected bankroll growth or depletion against these fixed dates to determine precise entry windows that avoid overextension. Data from industry reports shows players who track both elements together reduce variance exposure during high-stakes periods and maintain steadier participation rates through the year.
Components of Bankroll Curves in Tournament Contexts
A bankroll curve plots cumulative results against time and incorporates buy-in amounts, average return rates, and variance buffers calculated from historical performance metrics. Researchers at academic institutions have documented how these curves typically exhibit plateaus during off-peak months followed by steeper declines or recoveries around clustered festival periods. Those who study player databases find that curves flatten when entries occur too close together without adequate recovery intervals between them.
Key variables include starting bankroll size, expected value per tournament, standard deviation of results, and the frequency of overlay opportunities that alter effective costs. Figures from regulatory bodies in Nevada reveal consistent patterns where players entering multiple events within a 14-day window experience amplified drawdowns unless prior results have lifted the curve above a defined threshold multiple of the largest buy-in.
Mapping Tournament Calendars to Financial Trajectories
Major circuits release schedules months in advance, allowing analysts to overlay event dates onto personal bankroll projections using spreadsheet models or dedicated software. Summer festival clusters create dense blocks where entry timing hinges on whether a player's curve sits above or below the cumulative buy-in total for the series. Data indicates that spreading entries across preliminary online qualifiers rather than direct festival registration preserves curve stability when live fields exceed projections.
Regional variations matter because European tours peak in different quarters than North American or Asian circuits. Those tracking multiple calendars observe that July often features overlapping series that test synchronization skills more than other months. In July 2026 several circuits have announced staggered start dates that create natural gaps for recovery, giving players additional flexibility when aligning entries with upward-trending portions of their bankroll curves.
Techniques for Achieving Synchronization
One established method involves setting milestone thresholds on the bankroll curve that trigger specific entry decisions, such as allocating a fixed percentage only after the curve exceeds a rolling 30-day average. Another approach segments the calendar into entry zones based on historical field sizes and overlay frequency, then matches these zones to projected curve positions derived from win-rate assumptions. Players apply these techniques by updating projections weekly and adjusting entry plans when actual results deviate from modeled paths.
Software tools that import both bankroll data and schedule feeds automate much of the overlay process, highlighting optimal entry weeks where the gap between projected funds and required buy-ins remains within safe parameters. Studies from research institutions show that users of such systems maintain participation consistency across seasons because decisions rest on quantitative alignment rather than calendar pressure alone.
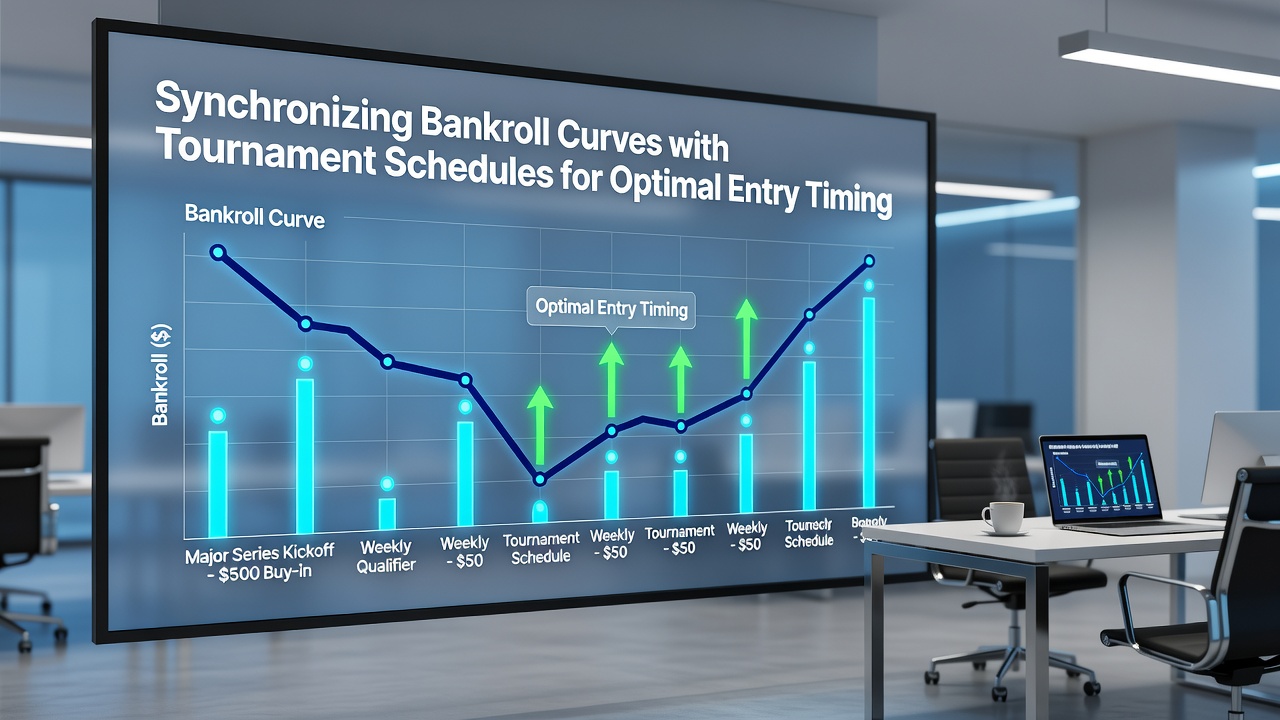
Illustrative Patterns from Player Data
Take one dataset covering several thousand tournament participants where researchers tracked curve positions at the moment of each entry decision. The analysis found higher survival rates through deep runs when entries occurred during ascending curve segments rather than during flat or declining phases. Another set of records from Australian regulatory tracking shows similar correlations between pre-event bankroll levels and continued engagement across multi-week festival periods.
Examples also include players who shifted from direct entries to satellite routes when their curves sat near minimum thresholds, thereby preserving capital while still accessing main events. These adjustments demonstrate how synchronization extends beyond simple timing and incorporates alternative qualification paths that interact with the curve differently than outright purchases.
Adjustments for Evolving 2026 Calendars
Schedule changes announced for mid-2026 introduce new mid-month gaps that alter previous clustering patterns, requiring updated curve models that account for longer recovery windows. Observers tracking these shifts note that players who recalibrate projections quarterly maintain better alignment than those relying on static annual plans. Government sources from multiple jurisdictions continue to publish aggregated participation statistics that help refine baseline assumptions used in individual curve forecasts.
Conclusion
Effective synchronization combines ongoing bankroll tracking with detailed schedule analysis to identify entry points that match available resources to event requirements. Players who integrate these elements through regular projection updates and threshold-based rules demonstrate measurable consistency in participation across annual cycles. Continued refinement of models using fresh data ensures alignment remains accurate as calendars and personal results evolve.