Revealing Continuation Bet Frequency Trends Using Tracking Tools in Varying Poker Stakes
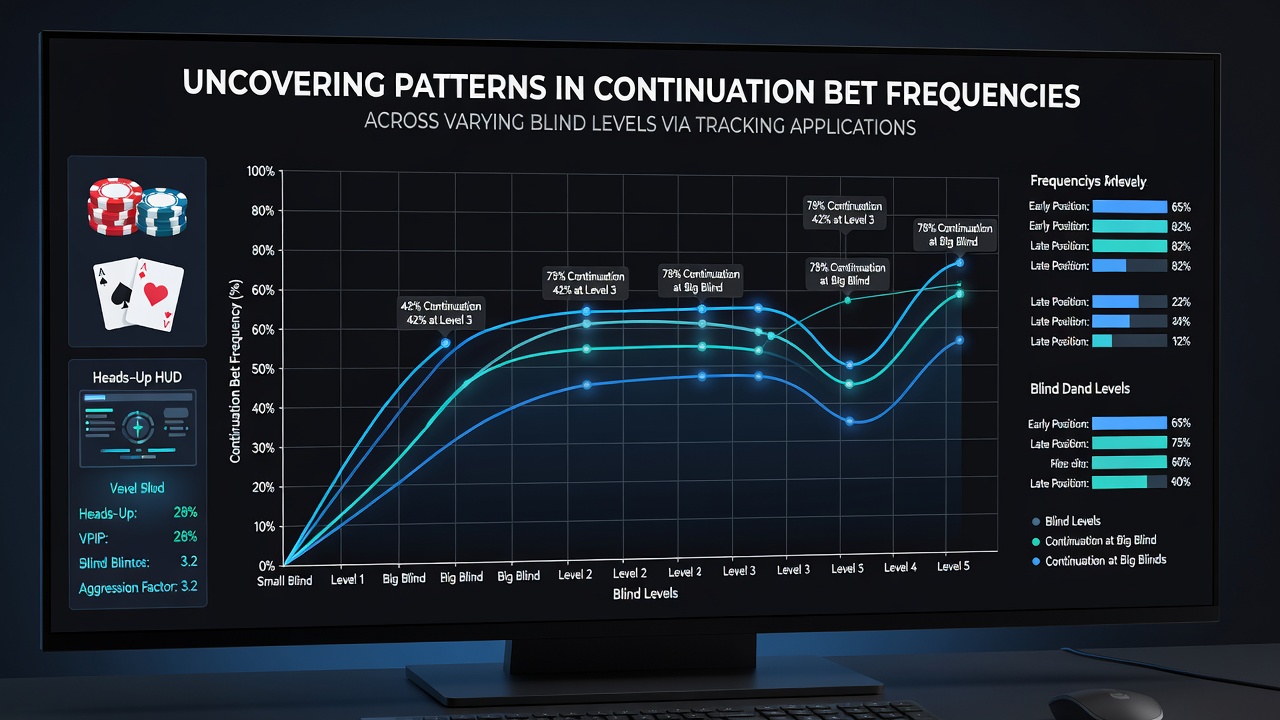
Tracking applications have become central to modern online poker analysis as players seek measurable edges in competitive environments and continuation betting represents one of the most frequently studied actions in postflop strategy. Data collected through these tools reveals distinct patterns in how often players follow through with bets after raising preflop and these frequencies shift noticeably when blind levels increase from micro stakes to higher mid stakes games.
Core Mechanics of Continuation Betting
Continuation betting occurs when the preflop aggressor makes the first bet on the flop regardless of whether the hand connects with the board and tracking software records these instances across thousands of hands to establish baseline frequencies for different player pools. Software platforms categorize actions by position, stack depth, and board texture while logging exact blind levels at the time of each decision which allows analysts to isolate variables that influence betting rates.
Studies from gaming research institutions show that average continuation bet frequencies hover around 55 to 65 percent in low blind games but climb or drop depending on opponent tendencies and game format. Tracking applications break this data into segments that highlight how regulars adjust their ranges compared to recreational participants who often maintain steadier but less optimized patterns throughout sessions.
Blind Level Impact on Player Behavior
Blind levels directly affect risk perception because higher blinds compress stack to pot ratios and force quicker decisions which tracking data captures through aggregated hand histories. At lower blind levels players tend to continuation bet more frequently on dry boards yet reduce aggression on coordinated textures where multiple opponents remain and this shift becomes more pronounced as blinds rise because pot sizes grow faster relative to remaining stacks.
One study released by a Canadian research center in early 2026 documented a 7 percent drop in continuation bet frequency when moving from 0.05/0.10 to 0.50/1.00 blinds among the same player cohort tracked over six months. The figures reveal that participants facing higher blinds checked back more often on flops that missed their perceived ranges while increasing barreling rates on later streets to compensate for reduced fold equity at the initial betting round.
Tracking Application Capabilities
Modern tracking tools integrate hand importing from multiple poker networks and apply filters that sort continuation bet data by blind level, position, and opponent type which produces visual reports showing frequency breakdowns over time. Users can compare their own statistics against population averages within specific stake categories and these comparisons help identify leaks such as over-betting in high blind games where fold equity declines.
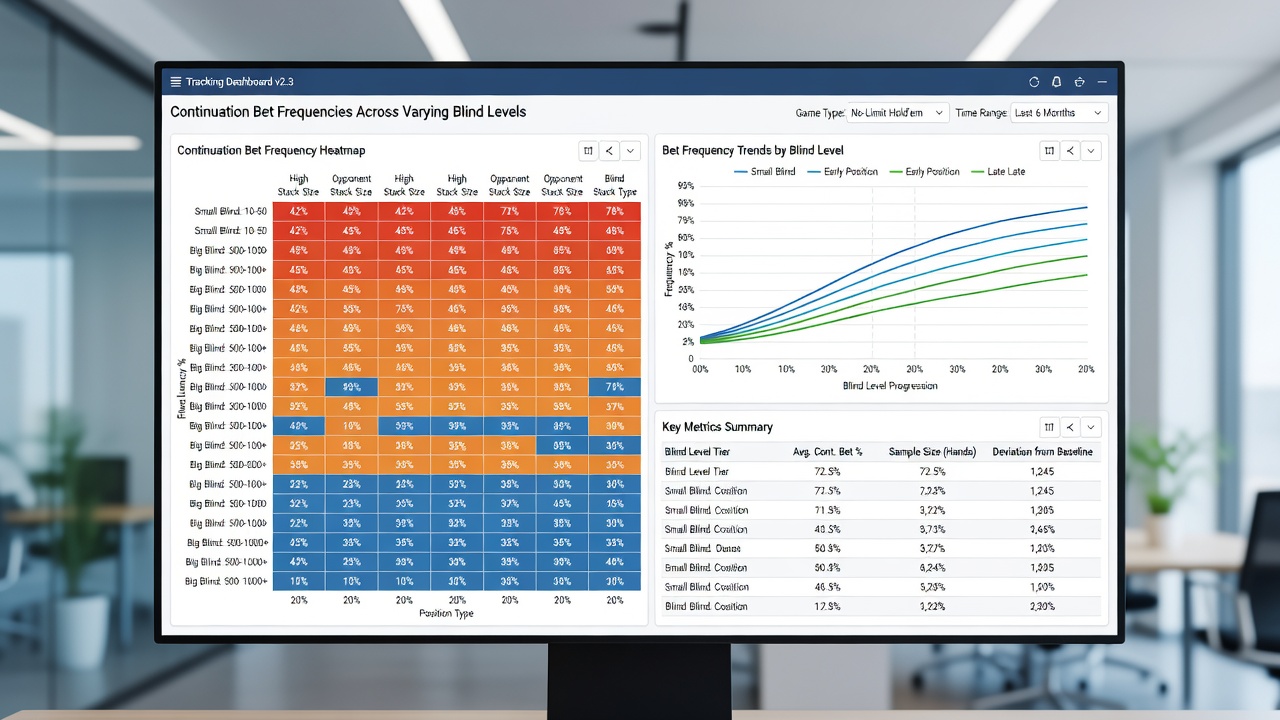
Advanced features include equity calculations that factor in board runouts and opponent calling ranges which allow users to simulate adjustments before implementing them in live play. Reports generated in July 2026 highlighted seasonal spikes in aggressive continuation betting during summer tournament series when player pools expand with less experienced participants entering higher blind events.
Observed Patterns Across Stake Tiers
Data aggregated across major online rooms indicates that micro stake regulars continuation bet approximately 62 percent of the time in position while this figure falls to 48 percent at mid stakes where opponents defend wider and exploit predictable lines more consistently. Out of position frequencies show even steeper declines because positional disadvantage amplifies the cost of failed continuation bets when blinds consume larger portions of effective stacks.
Tracking applications also segment data by game type and reveal that six max formats produce higher overall continuation bet rates than full ring tables because fewer opponents reduce the likelihood of resistance. Multiway pots in higher blind games see the sharpest reductions in betting frequency as players recognize diminished success rates when multiple ranges remain live postflop.
Strategic Adjustments Based on Data
Players reviewing their tracked statistics often discover that lowering continuation bet frequency on certain board types in higher blind environments improves long term results because it preserves stack depth for later streets where value can be extracted more reliably. Conversely some datasets suggest increasing flop aggression in low blind cash games where recreational players fold too readily to single barrels.
Population reports published by industry analytics groups demonstrate that top performers maintain continuation bet frequencies within narrow ranges tailored to each stake level while adjusting based on recent session trends captured by their tracking software. These adjustments occur gradually as players test modifications across sample sizes large enough to produce statistically meaningful outcomes.
Conclusion
Tracking applications continue to provide granular visibility into continuation bet patterns that vary systematically with blind levels and the accumulated data supports targeted strategy refinements across different poker environments. Analysts and players alike rely on these tools to quantify adjustments that align with evolving game conditions and maintain competitive positioning in dynamic online fields.