Decoding Rival Tendencies in MTT Endgames Through Session Data Aggregation
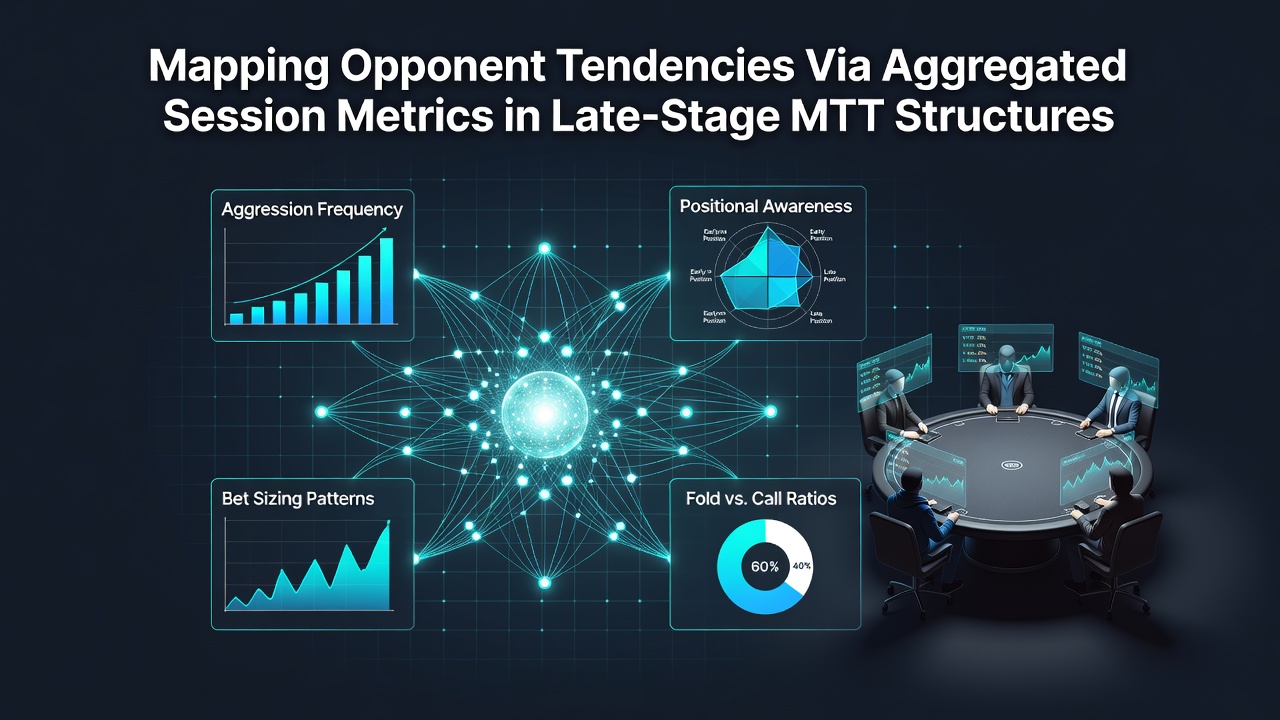
Players tracking opponent behaviors in multi-table tournaments have turned to aggregated session metrics as a core method for identifying patterns that emerge only after hours of play, and this approach becomes especially relevant once tournaments reach the final tables where stack sizes and payout structures dictate different risk thresholds. Data collection happens across multiple sessions rather than single events, which allows analysts to build profiles that account for variance while highlighting repeatable actions in pressure situations. Observers note that such aggregation reduces the noise from isolated hands and surfaces tendencies like frequency of continuation bets or fold rates under specific blind levels.
Core Components of Metric Aggregation
Session metrics in this context include voluntary put money in pot percentages, aggression factors, and positional win rates, all compiled from software logs that record actions across hundreds of hands. Researchers have documented how combining these figures from separate tournaments reveals shifts in player style as the field narrows, particularly when effective stacks drop below 30 big blinds. Platforms processing this data often apply filters that isolate late-stage scenarios, separating early accumulation phases from bubble and final table play so comparisons stay relevant to the structures that matter most.
Software tools pull timestamps, position data, and bet sizing together, then normalize results across different tournament buy-in levels to create comparable datasets. This process shows that certain opponents increase their three-bet frequency by measurable margins once they reach the money, while others tighten their calling ranges dramatically. Those who've studied these outputs point out that the aggregation step requires consistent sample sizes, usually several thousand hands, before confidence intervals become narrow enough for practical use in real-time decisions.
Late-Stage MTT Dynamics and Data Patterns
During the later stages of MTTs, payout jumps create inflection points where metrics collected from earlier rounds lose predictive value unless they have been segmented properly. Aggregated data helps isolate how players adjust their opening ranges when antes come into play or when they face ICM pressure near pay jumps. Evidence from tracking systems indicates that players who maintain steady aggression factors across sessions tend to accumulate chips more effectively in these spots, whereas those whose metrics fluctuate widely often leak value through predictable over-folding.
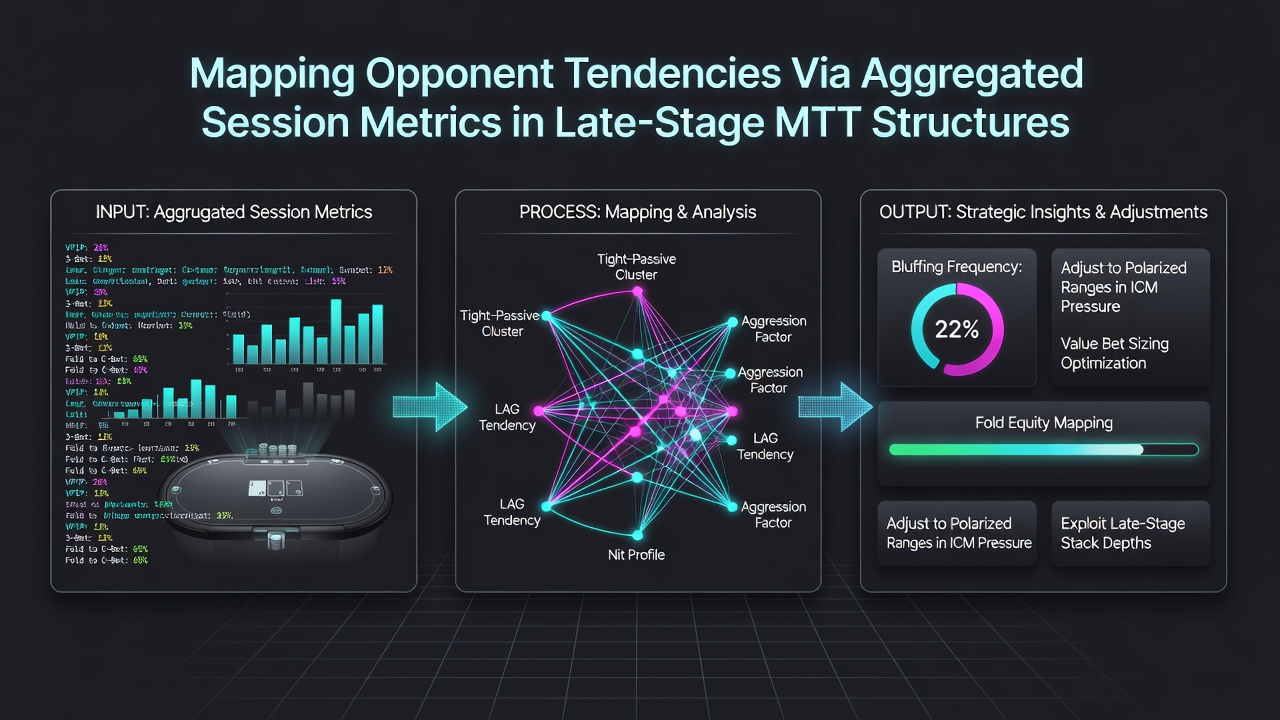
June 2026 updates to several major tracking platforms introduced improved segmentation for final table play, allowing users to query metrics filtered by remaining player count and average stack depth. These refinements make it easier to map how specific opponents respond when they hold middle pairs facing all-in decisions with 15 big blinds or less. Aggregated results across large player pools demonstrate that fold equity calculations shift measurably once the field drops below 10 percent of the starting entrants, a change that single-session observations frequently miss.
Implementation Through Available Tools
Users import hand histories from supported sites into databases that calculate derived statistics such as steal success rates and blind defense frequencies broken down by tournament phase. Filters then isolate late-stage data points, enabling direct comparison between a player's overall aggression factor and their behavior when effective stacks fall into the push-fold zone. According to reports from the American Gaming Association, adoption of these analytical methods has grown steadily among serious tournament participants who maintain records across multiple years of play.
Case studies compiled by independent researchers show one player whose aggregated metrics revealed a 40 percent increase in river betting frequency during final tables compared with earlier stages, prompting adjustments in calling ranges from observant opponents. Another dataset from Canadian tournament circuits highlighted how certain regulars reduced their continuation bet frequency by nearly 25 percent once pay jumps began, information that became actionable only after aggregation across dozens of events. These patterns surface reliably when the underlying data spans sufficient volume and includes consistent positional tags.
Limitations and Data Quality Considerations
Aggregation works best when hand histories include complete action sequences and accurate stack information, yet missing data from certain sites can skew results if not accounted for during import. Analysts therefore apply weighting systems that prioritize hands with full logging while downplaying partial records. Studies from academic sources on decision modeling, such as those hosted through university research portals, confirm that sample bias remains a concern when player pools are small or when certain stake levels dominate the dataset. Regular audits of imported files help maintain accuracy over time.
Conclusion
Aggregated session metrics provide a structured way to map opponent tendencies that appear consistently in late-stage MTT structures, giving participants clearer signals for adjustments once fields shrink and payout considerations intensify. Continued refinements in tracking software and filtering techniques support more precise segmentation, while geographic regulatory bodies in regions such as Nevada and Australia maintain oversight on data handling practices within licensed platforms. The method relies on volume and consistent categorization rather than isolated observations, which explains its growing role among players who compile records across repeated tournament entries.