Bankroll Strategies Powered by Analytics Across Poker Variants

Bankroll management in poker requires careful attention to variance patterns that differ sharply between cash games, tournaments, sit-and-gos, and mixed formats, and data tools now supply the metrics needed to track those patterns without relying on guesswork. Players who compete across multiple variants often face sudden swings that standard spreadsheets fail to capture, yet specialized software aggregates hand histories, win rates, and downswing probabilities into visual reports that highlight risk thresholds at each stake level. Research from academic institutions shows that structured logging combined with simulation models reduces the frequency of bustouts by identifying when a player has exceeded recommended buy-in multiples for a given format.
Format-Specific Variance and Tool Integration
Cash game sessions produce relatively steady but smaller edges that data platforms measure through hourly win rates and standard deviation figures, while tournament play introduces long periods of zero return followed by occasional large payouts that require Monte Carlo simulators to forecast survival rates. Observers note that tools such as Holdem Manager and PokerTracker pull live data feeds from multiple sites, allowing users to segment results by game type and then apply filters that flag when a bankroll has dropped below twenty buy-ins in cash games or fifty in multi-table tournaments. Those who've studied this process discover that combining equity calculators with bankroll trackers creates alerts triggered by consecutive losing sessions, prompting stake reductions before deeper drawdowns occur.
Players who switch between no-limit hold'em cash tables and pot-limit Omaha tournaments encounter additional complexity because the two formats carry distinct volatility signatures that single-metric spreadsheets cannot isolate. Data platforms address this by importing hand histories from each variant into unified databases, then generating separate risk-of-ruin curves that adjust automatically when a user logs results from different structures. Figures from industry reports indicate that participants who review these segmented reports weekly maintain steadier bankrolls than those who review aggregate totals alone.
Real-Time Dashboards and June 2026 Trends
By June 2026, several platforms had introduced cloud-synced dashboards that pull current session data across desktop and mobile clients, displaying live standard deviation bands alongside projected bankroll trajectories under different volume assumptions. These interfaces allow users to input upcoming schedule changes, such as a shift from weekly deep-stack events to daily turbo tournaments, and instantly recalculate required reserves. Researchers at gaming analytics centers have documented that players who consult such dashboards before each session adjust their session lengths and stake selections more precisely than those relying on end-of-month reviews.
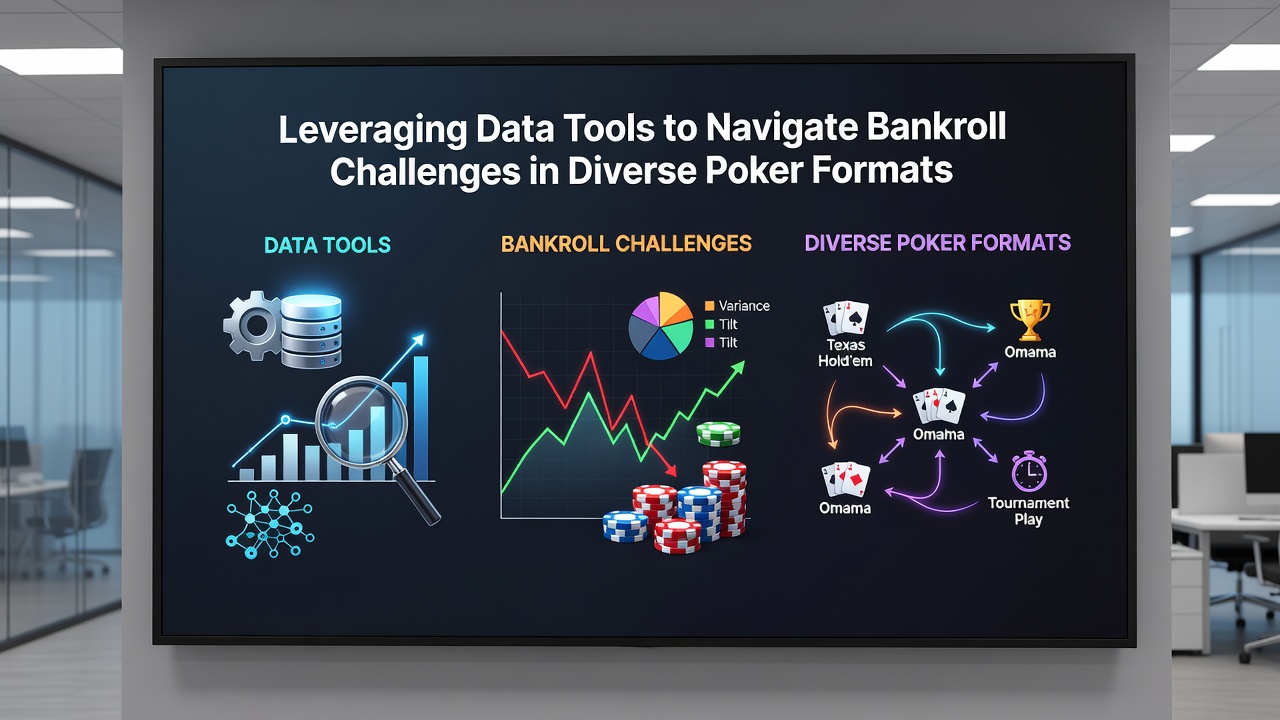
One case involved a mid-stakes regular who imported six months of results from both cash games and bounty tournaments into a single workspace, revealing that bounty formats produced higher variance than previously estimated. The player then used the platform's scenario planner to test reduced buy-in counts during high-variance periods, which data logs later confirmed stabilized the overall bankroll trajectory. Such examples illustrate how granular filtering turns raw hand data into actionable thresholds rather than vague warnings.
Multi-Site Tracking and Regulatory Context
Operators in regulated markets supply downloadable hand histories that feed directly into these tools, yet players must still reconcile data across different jurisdictions where export formats vary. According to statistics released by the Nevada Gaming Control Board, online poker volume in that state continues to generate millions of hands monthly, providing ample sample sizes for variance calculations when users aggregate across sites. Similar data access exists through provincial regulators in Canada, where reports from the Alcohol and Gaming Commission of Ontario document rising participation in mixed-game formats that further complicate bankroll formulas.
Those managing bankrolls across regions often link their tracking software to public industry reports so they can compare personal results against aggregate market trends, such as average rake impact or typical downswing lengths during promotional periods. This external benchmarking helps isolate whether a current dip stems from personal play or broader format dynamics. Tools that import these third-party datasets alongside personal histories produce composite views that single-site exports cannot achieve.
Conclusion
Data tools convert fragmented poker results into coherent bankroll models by separating variance signals by format, applying real-time filters, and incorporating external benchmarks from regulatory sources. Players who maintain consistent imports and review segmented reports position themselves to respond to drawdowns with measured stake adjustments rather than reactive decisions. Continued expansion of cloud-based analytics through 2026 suggests these capabilities will become standard practice for anyone navigating multiple poker structures simultaneously.