Analytics Programs Track Evolving Patterns in Extended Multi-Table Poker Sessions

Multi-table poker sessions have grown more complex as players manage several games simultaneously, and analytics programs now capture detailed shifts in decision-making over hours of continuous play. These tools compile data on hand selection, bet sizing, and response times while identifying how performance metrics change as sessions extend beyond typical durations.
Data Collection in Multi-Table Environments
Analytics programs pull information directly from poker client APIs and hand history files to build comprehensive player profiles. Each table generates separate streams of data that combine into unified reports showing overall session trends. Researchers note that programs record thousands of data points per hour across active tables, which allows for precise mapping of behavioral adjustments during prolonged periods.
Software platforms integrate timers and statistical overlays that flag deviations from established baselines. Players often maintain consistent aggression factors early in sessions, yet these same metrics frequently decline after four or five hours according to aggregated platform reports. The programs highlight these changes without requiring manual input, which frees users to focus on active decisions rather than post-session reviews.
Patterns Emerging From Extended Play
Analytics reveal consistent patterns in how multi-table dynamics evolve. Decision speed tends to slow as cognitive load increases, while hand volume per table may drop when attention splits across additional windows. Data indicates that fold frequency rises in later stages for many participants, which aligns with observations from large-scale hand databases maintained by industry research groups.
One study released in early 2026 examined over 2 million hands from multi-table cash games and found measurable drops in expected value calculations after the sixth hour of continuous play. These findings came from anonymized datasets processed through machine learning models that isolate fatigue-related variables. Programs also detect changes in positional awareness, where players begin to overlook late-position advantages they exploited earlier in the same session.
Software Features Driving Insight
Modern analytics tools offer real-time heat maps that color-code table performance based on win rates and variance. Users can toggle between individual table views and combined session summaries to spot which games contribute most to overall results. Filters allow sorting by time segments, which makes it easier to compare early-session metrics against later ones without exporting raw files manually.
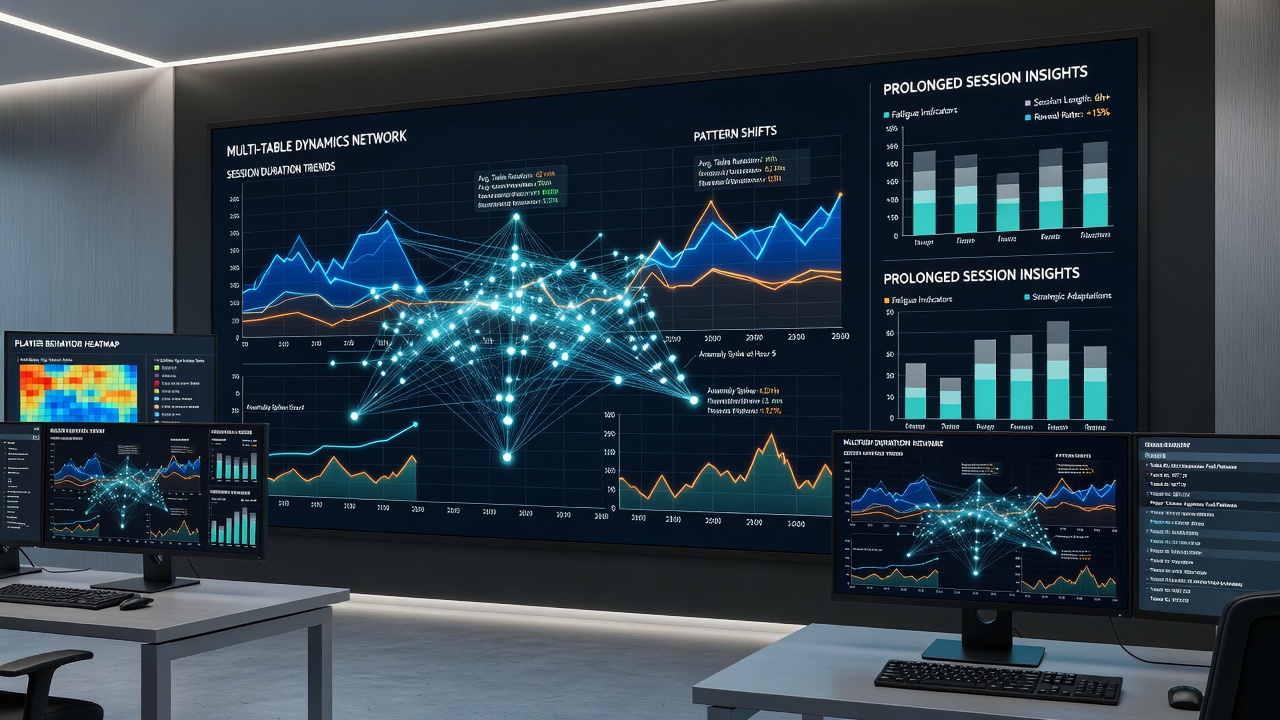
Integration with external databases lets programs cross-reference personal results against population trends from similar stakes and formats. This comparison highlights whether observed shifts represent individual fatigue or broader session-length effects seen across thousands of players. Reports generated in June 2026 incorporated updates that track multi-way pot frequencies more accurately, revealing how table dynamics change when opponents adjust their ranges over time.
Regional Regulatory Context and Reporting Standards
Online poker operators in various jurisdictions must comply with data reporting requirements that indirectly support analytics development. The New Jersey Division of Gaming Enforcement publishes monthly summaries of online gaming activity that include session duration statistics, while similar bodies in other regions maintain comparable records. These public datasets provide context for private analytics programs seeking to benchmark user patterns against industry averages.
Academic researchers have accessed portions of these records through approved channels to study behavioral trends. Their work shows that prolonged sessions correlate with increased variance in outcomes, though individual results depend heavily on game selection and stake levels. Programs now incorporate filters that align personal data with these broader regulatory reports for more accurate comparisons.
Practical Applications for Players and Observers
Coaches and training sites use aggregated analytics outputs to illustrate how session length influences specific strategy elements. Video reviews often feature side-by-side comparisons of hand histories from hour one versus hour seven, which demonstrate concrete examples of the patterns programs detect. Players who review these materials gain objective measures of their own tendencies without relying on memory alone.
Platform updates scheduled for later in 2026 aim to add predictive elements that forecast potential performance decline based on historical user data. Such features would alert participants when their current session metrics begin to diverge from established norms, allowing informed decisions about continuing or pausing play.
Conclusion
Analytics programs continue to refine their ability to document shifting multi-table dynamics throughout extended sessions. By combining detailed hand data with time-based segmentation, these tools deliver objective records of how performance evolves under sustained conditions. Regulatory reports from multiple jurisdictions supply supporting context that strengthens the reliability of private analyses, while ongoing software improvements promise even more precise tracking in coming months.